3-7 Jtop Tool Usage
Learning Objectives
This chapter will introduce you to jtop, a real-time monitoring tool specifically designed for NVIDIA Jetson series platforms. By the end of this chapter, you'll understand jtop's capabilities in monitoring system resources like CPU, GPU usage, temperature, and power modes. You'll also learn how to install and enable the jtop tool from the Jetson Stats package. With this knowledge, you'll be able to effectively monitor your Pandora development board's system status, helping you troubleshoot performance bottlenecks and system anomalies, thus improving development efficiency and stability.
Installing Jtop
1. Install the Jetson Stats tool package (if you haven't already), which includes jtop:
sudo pip3 install jetson-stats
2. Install the Jetson Stats tool package (if you haven't already), which includes jtop:
sudo jtop
3. Jtop Tab Overview
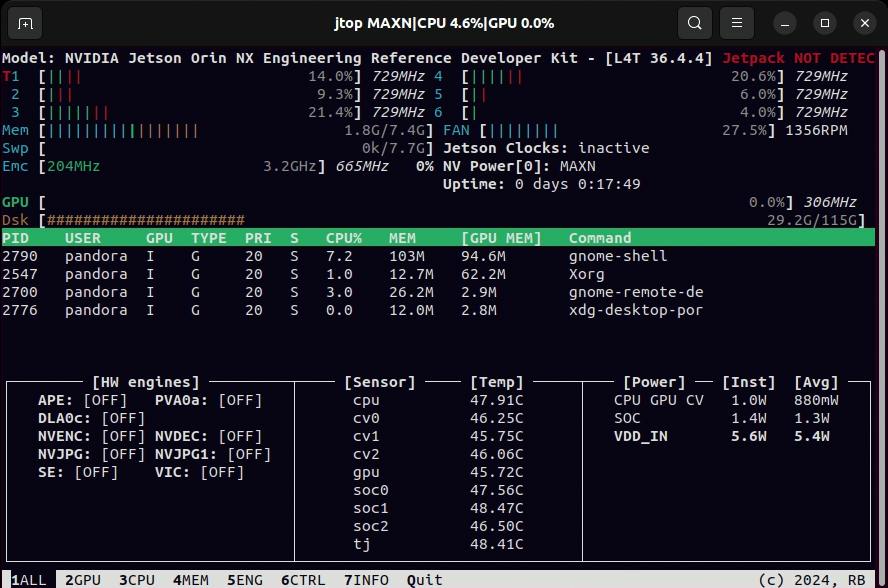
(1) ALL: Displays the real-time status of overall system resources.
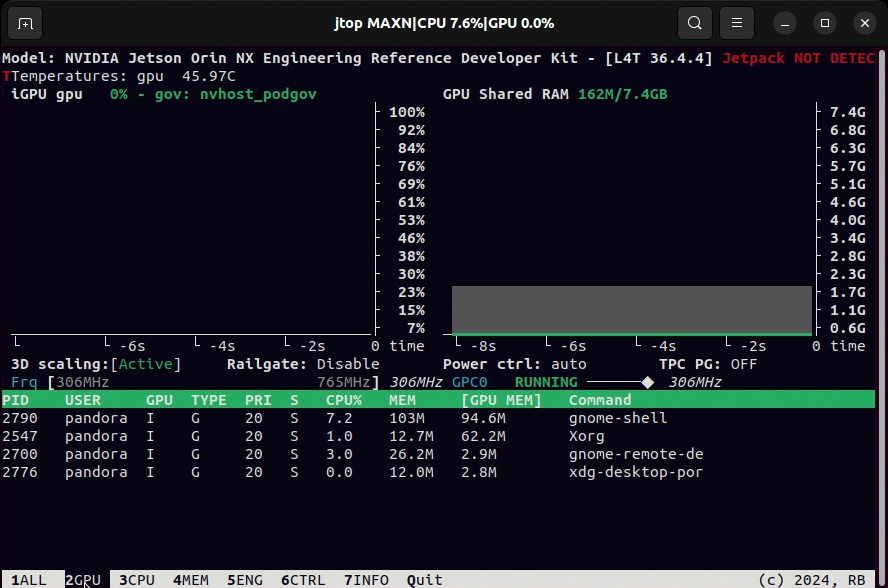
(2) GPU: Monitors GPU usage, temperature, and clock speed information.
(3) CPU: Shows the usage status and frequency of each CPU core.
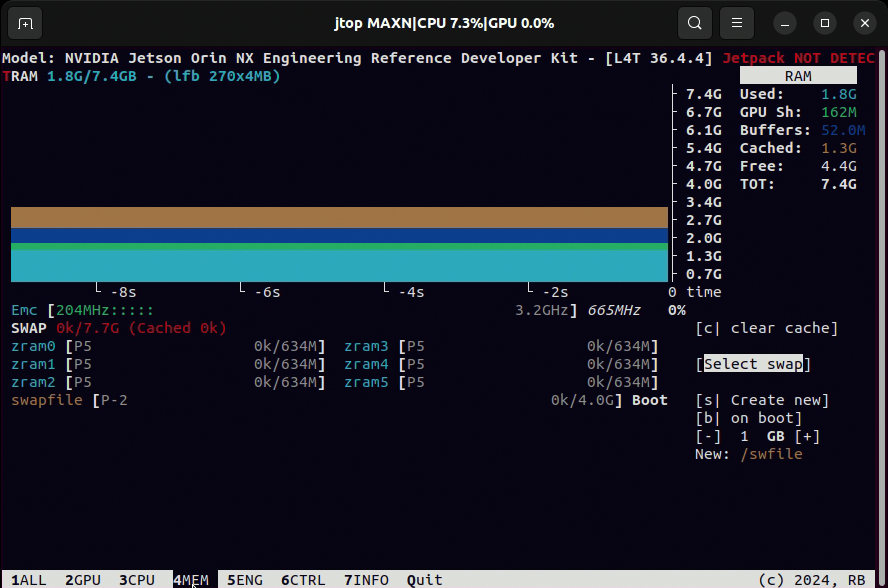
(4) MEM: Views memory and Swap usage and their respective percentages.
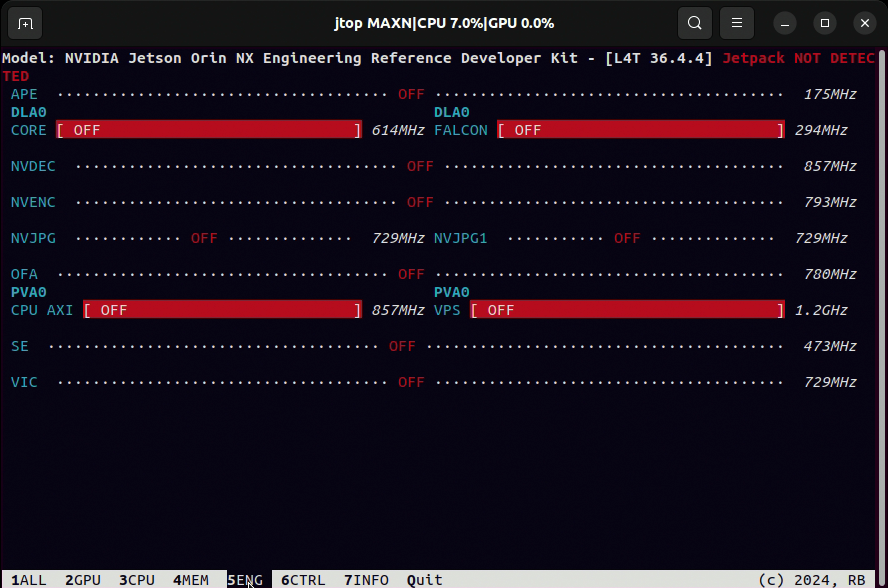
(5) ENG: Lists the operational status of Jetson-specific hardware acceleration engines.
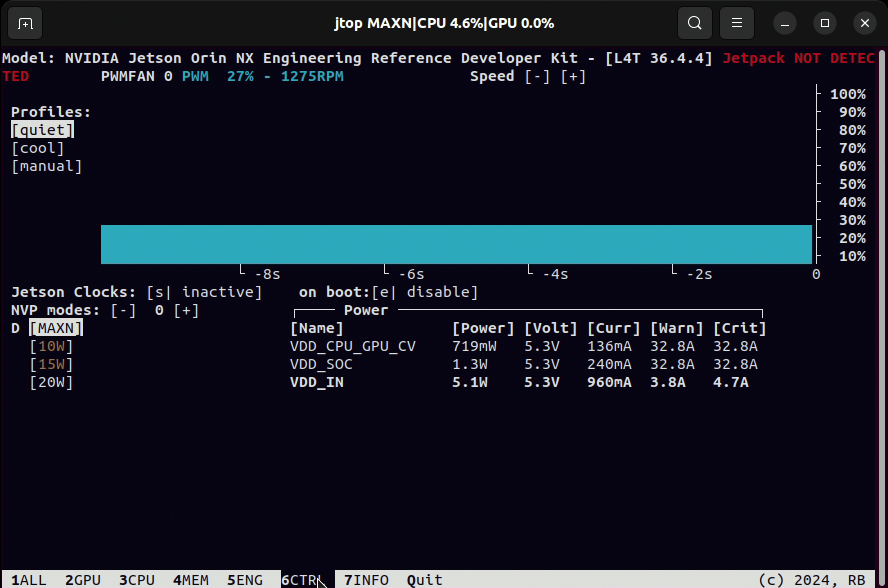
(6) CTRL: Allows adjustment of power modes, fan settings, and core control.
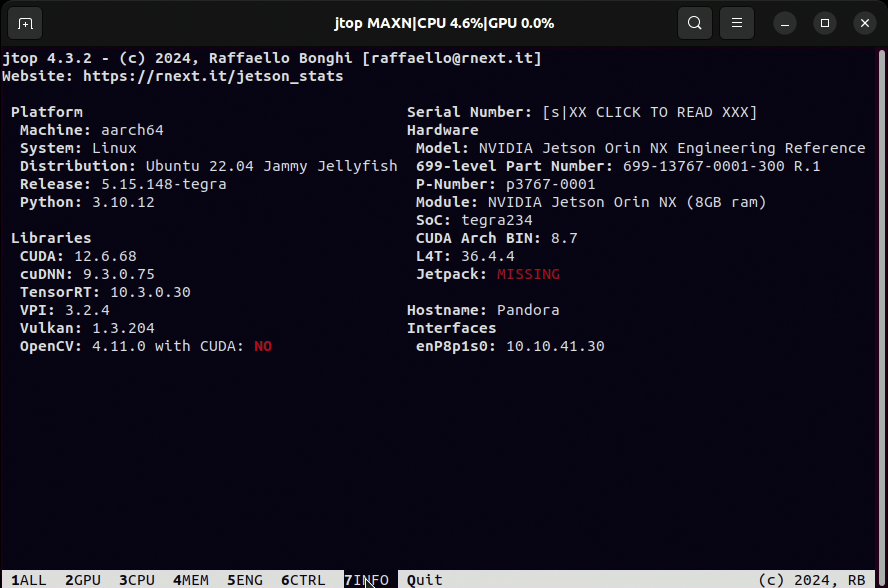
(7) INFO: Provides system version, hardware model, and boot information.
For more detailed usage instructions and advanced features of jtop, please refer to the official GitHub documentation: https://github.com/rbonghi/jetson_stats
Adapted from the original YUAN Developer Hub article. Source ID: 285.